Documents and data
Hidden decimals in Excel: How to avoid differences between what you see and what you export
A guide to distinguishing how a number looks from the calculation rule you need, checking discrepancies, and verifying an export before sharing it.
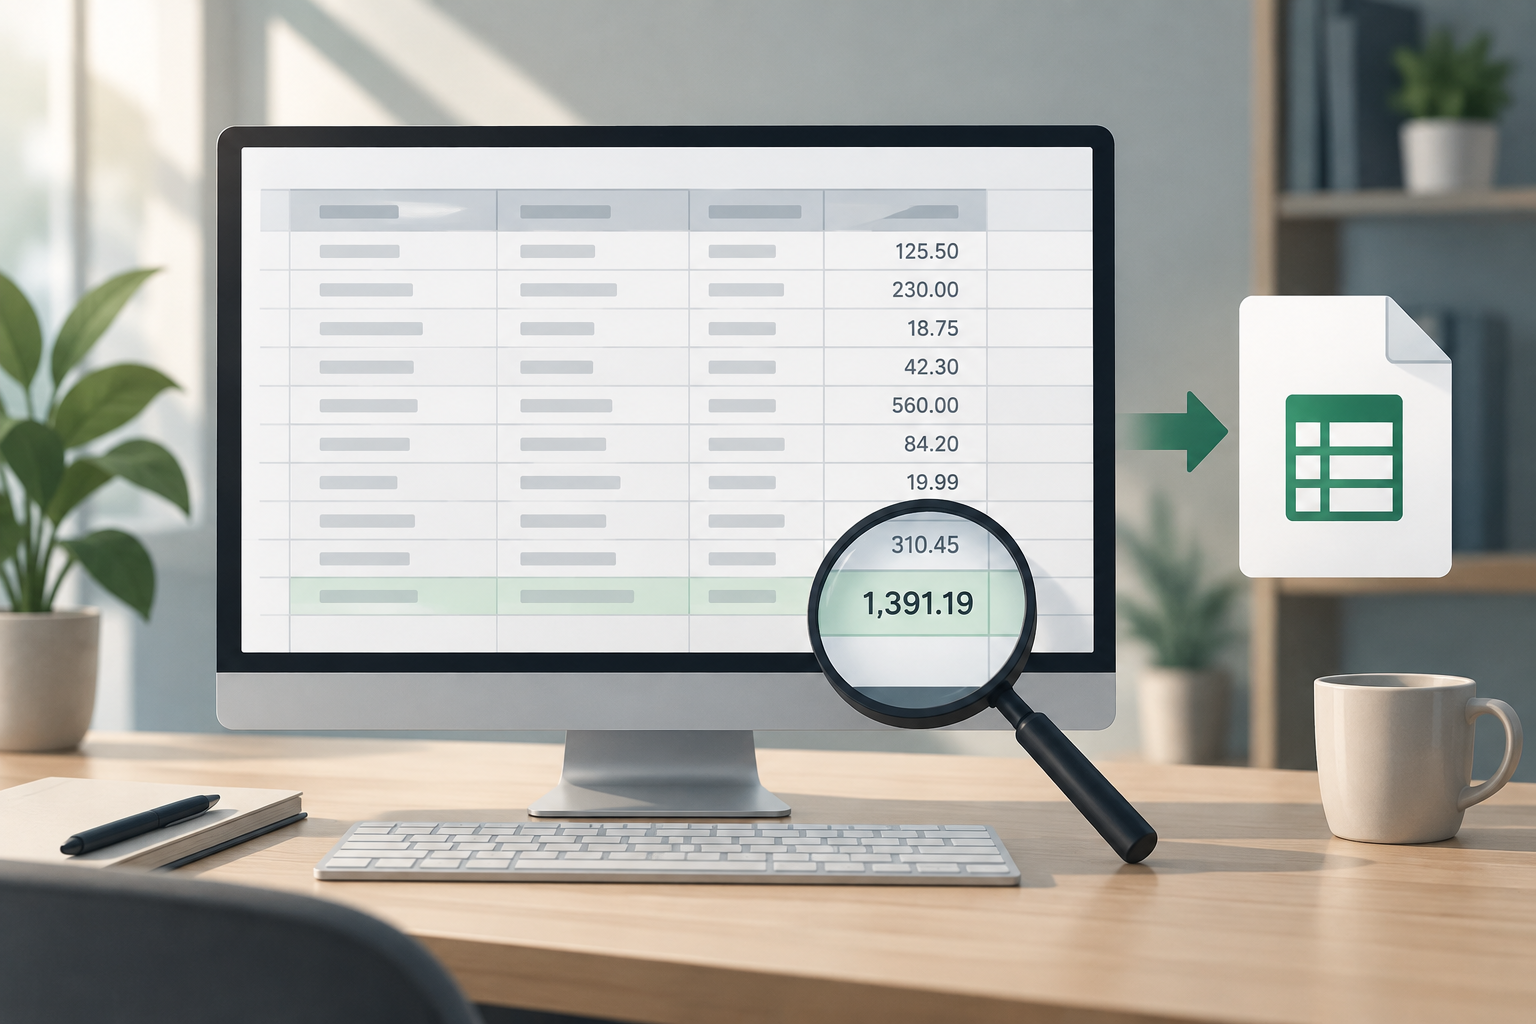
What it means when a spreadsheet displays fewer decimal places
The number displayed in a cell does not always tell you how many decimal places the value used in a calculation has. For example, a cell might display an amount with two decimal places and reveal more digits when you increase the number of visible decimals. It helps to separate two questions: what value is being used, and what format is being used to display it.
In Excel, the Increase Decimal and Decrease Decimal controls display more or fewer digits after the decimal separator by changing the format. Consult Microsoft's documentation at https://support.microsoft.com/es-es/excel/round-a-number-to-the-decimal-places-i-want-in-excel to verify this description. A change on screen, by itself, does not prove what value will be used in each calculation; check the result using a copy and the procedure you actually need.
- Note the displayed precision before changing the format.
- Distinguish between changing the presentation and applying an operation that produces a different value.
- Do not assume an export will display figures in the same way as the spreadsheet.
Why a total may differ from the rounded figures you see
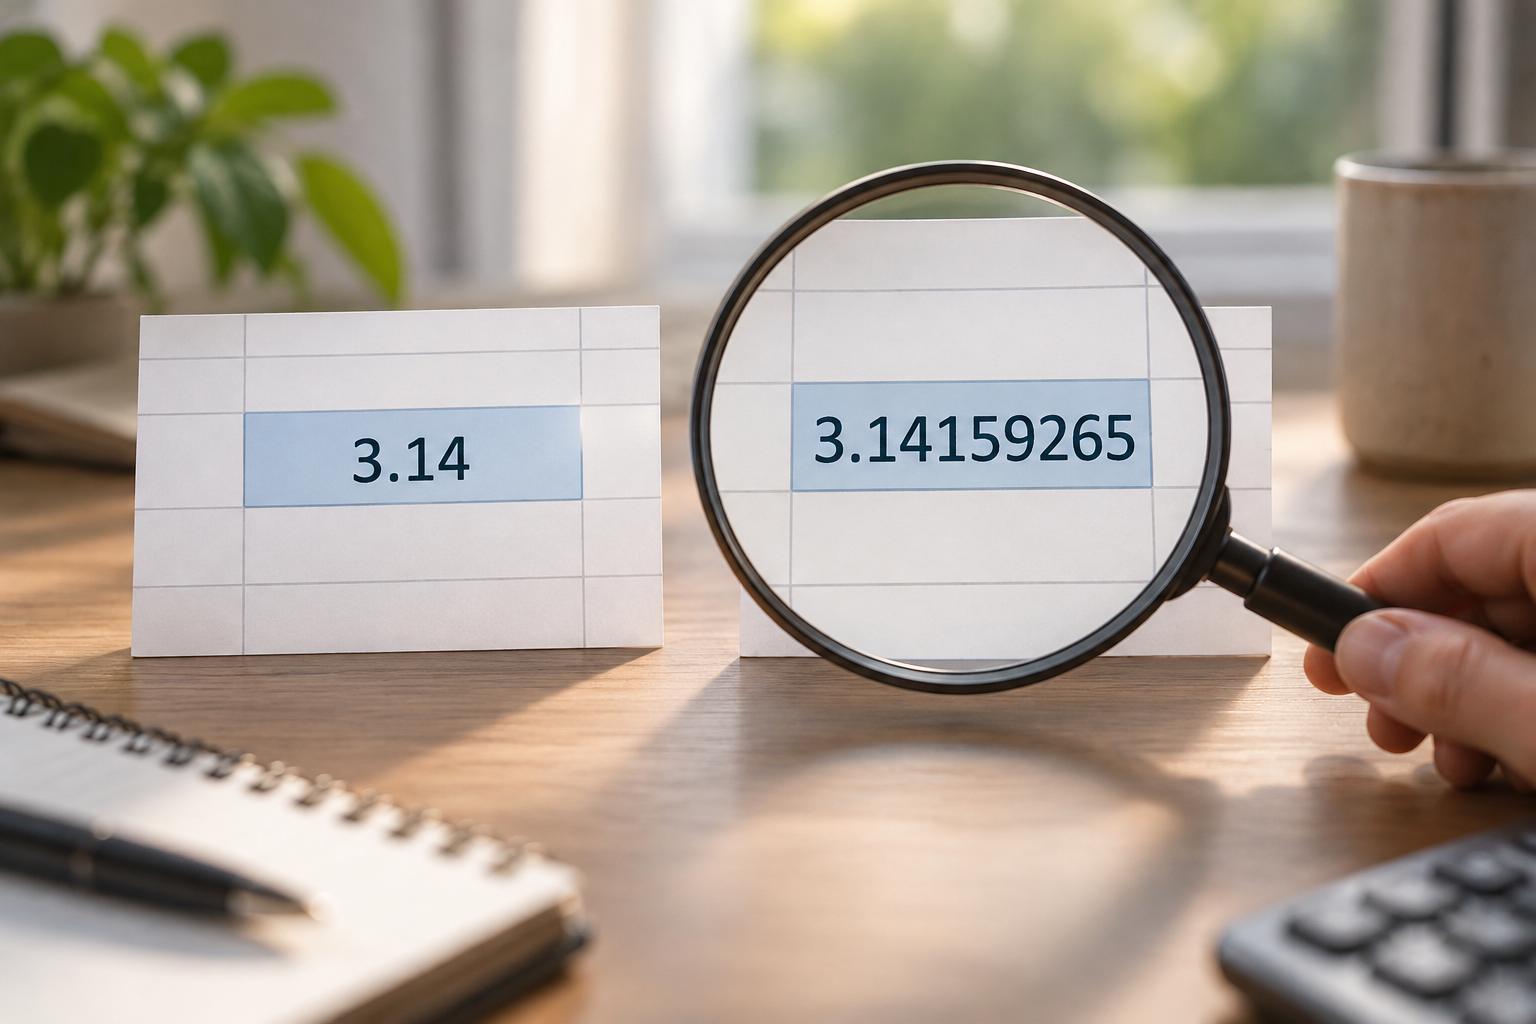
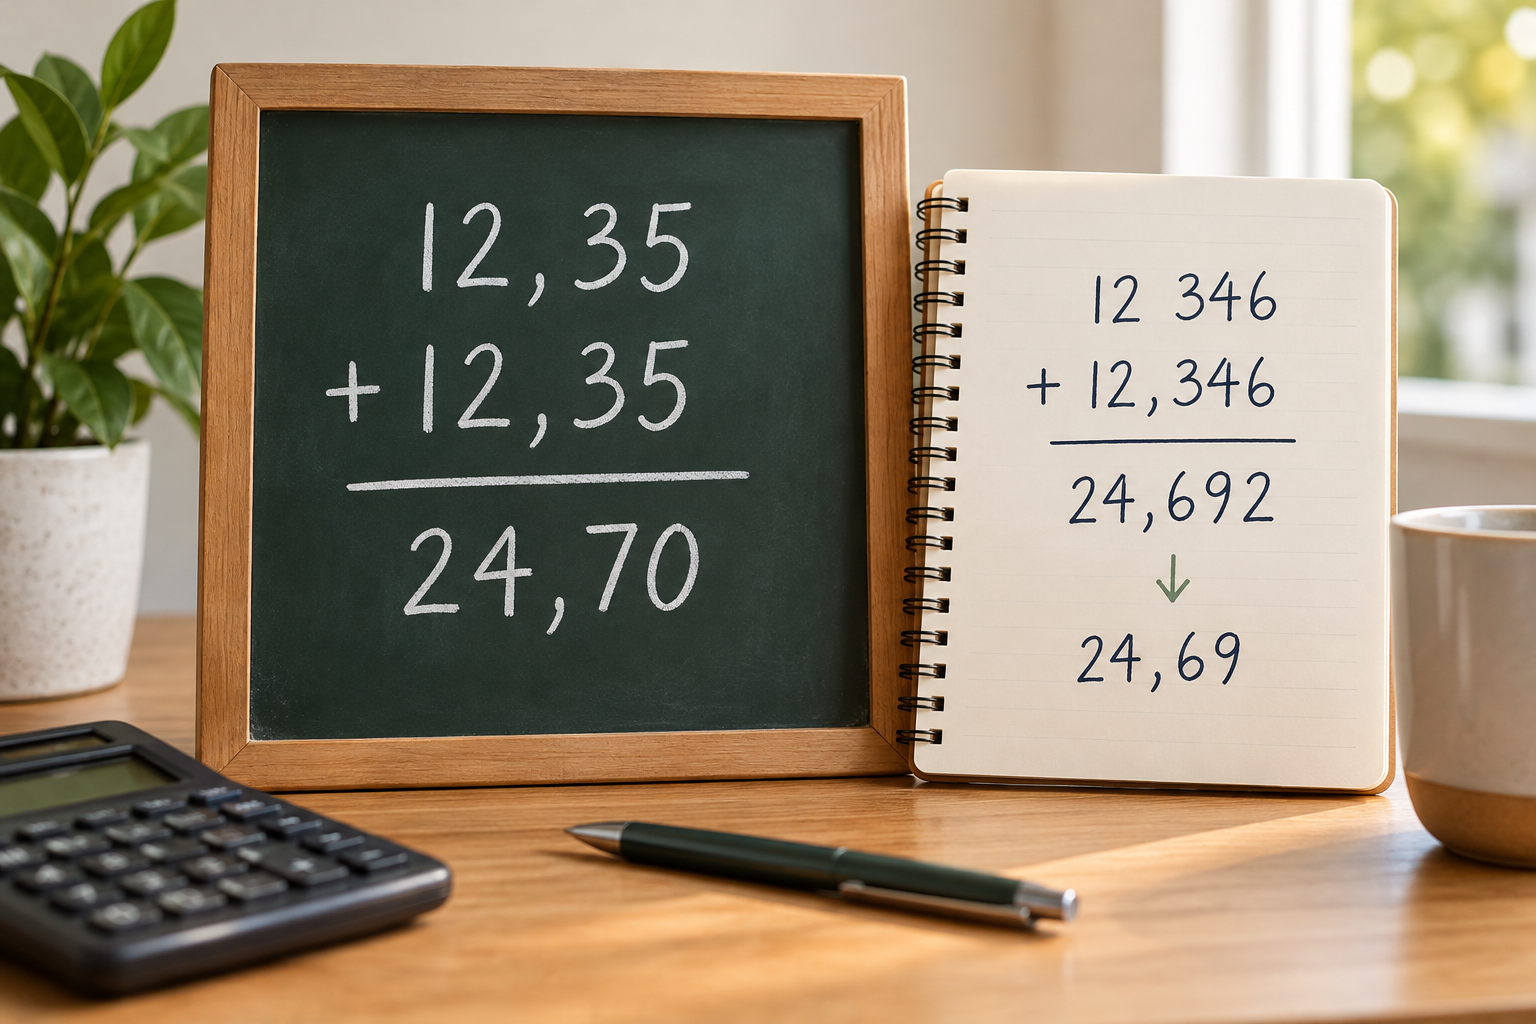
Consider two example values: 12.346 and 12.346. If both are displayed rounded to the nearest hundredth, they appear as 12.35, and their visible sum is 24.70. The sum of the full values is 24.692, which is displayed as 24.69 when rounded to the nearest hundredth. The one-cent difference comes from comparing the sum of figures that have already been rounded with the sum of more precise values.
This mathematical example depends on the stated rounding rule; it does not claim that Excel uses this display or rule in every circumstance. If you find a discrepancy, compare equivalent values and note which figures you see, what result you get, and how that result is displayed.
- Compare full values with full values, or rounded amounts with rounded amounts.
- Confirm what the total represents before deciding which figures should be added.
How to inspect the figures used in the result
Start with a copy of the file. Increase the number of visible decimal places in some rows that contribute to the total, and also review the corresponding subtotal or result. The purpose is to inspect more digits, not to change the calculation rule this way. Check that the amounts you compare use the same unit or basis.
Trace the calculation from the result back to the source cells and note the intermediate steps. Review a varied sample that includes large values, small values, and values close to rounding boundaries. If you find an exception or discrepancy, expand the sample before deciding what to change.
- Keep the original file intact and work on a copy.
- Inspect relevant inputs and results with more decimal places visible.
- Note the source cells and the steps that lead to the result.
Cell formatting and actual rounding are not the same thing
Formatting lets you display an amount with a set number of decimal places. A rule applied to a calculation, by contrast, defines which value is used in an operation or returned as a result. Displaying fewer digits is not enough to conclude that the calculation uses a rounded value: Microsoft's documentation describes the decimal controls as options for displaying more or fewer digits.
If the process requires a defined precision, set that rule explicitly and test the calculation in the application the team will use. Keep the source data, calculated result, and any value prepared for communication clearly identified. If you create a transformed column, retain the original and label the new one clearly.
- If you only want to make the sheet easier to read, adjust the display and review the result again.
- If the calculation must use rounded figures, define and test an explicit operation.
- If you do not know the intended rule, check with the person who defines the report or import.
Define precision according to how the data will be used
In a budget, for example, calculating with full values and rounding the total at the end can produce a different result from rounding each line before adding them. The appropriate rule depends on how the report will be used and the requirements of the destination document or system. Confirm which total is expected and apply the agreed method consistently.
For percentages and measurements, distinguish the precision displayed from the precision the calculation needs. Document the unit, the figures you will communicate, and the point in the process where the rule is applied; do not infer calculation precision solely from how the cell looks.
- Clarify whether the rule applies to each line, subtotals, or the final total.
- For percentages and measurements, identify the precision needed for the intended use.
- Check that the agreed method matches the destination format.
Review dependent results and exports
Before changing a column, identify which results depend on it, such as totals, percentages, or data prepared for a report. Test the change on a sample that includes both typical and boundary cases, and compare the results with the agreed method. If you do not get the expected outcome, review the rule before applying it to the rest of the spreadsheet.
Before delivering or importing the file, export a sample in the intended format and compare its values, totals, and column names with the source. Review the actual exported file in the tool you plan to use: the display or handling of figures can vary between formats and applications. Keep the original and record which final copy you checked.
- List the results that depend on the column you plan to change.
- Test on a copy and review the results before applying the change more widely.
- Compare a sample of the exported file with the source before sharing it.
Frequently asked questions
Does Decrease Decimal change the cell value?
Microsoft's documentation describes these controls as options for displaying more or fewer digits through formatting. Do not infer from the visual change alone what value is used in calculations; check with a copy and a test.
Why doesn't the total match the sum of the amounts I can see?
You may be comparing a calculation using values with greater precision against a manual sum of figures rounded for display. Inspect the figures and confirm which rule is expected for the report.
Can I assume an export will keep the same decimal places?
Do not assume so. Compare a sample of the exported file, a total, and the relevant columns with the source, using the format intended for delivery or import.
Where can I review the file without altering the original?
Apification Cloud lets you manage versions, and its editor lets you create and edit spreadsheets with ONLYOFFICE within Cloud. Work on a copy and review the results in the application and format you plan to use.
Sources and further reading
Documentation consulted while preparing this article.
- Redondear un número a las posiciones decimales deseadas en Excel — Microsoft Support
- Cómo quitar los decimales en Excel — Gerencie.com
Explore Apification
Related articles

Documents and data
Hidden Rows in Excel: How to Check a Sheet Before Sharing
A sheet that looks incomplete has not necessarily lost data. Learn to check filters, hidden rows, and expected records before sharing a copy.

Documents and data
How to Make a Spreadsheet More Accessible for Screen Readers
A practical guide to organizing sheets, headings, and tables, reducing navigation barriers, and testing the file before sharing it.
Documents and data
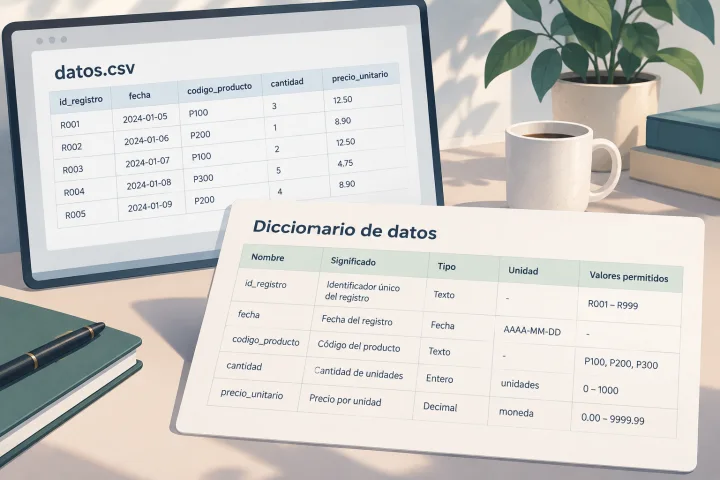
A Data Dictionary for a CSV: How to Document Every Column
A CSV can open without errors and still be difficult to interpret. Learn how to document names, types, codes, missing values, units, and dates with a practical template.